Every nonprofit should know about these free and simple tools to create professional graphics for presentations, websites, social media, proposals, posters, and programs. You can instantaneously save on your bottom line. You can create your own invitations and marketing materials. And you can make your proposals, presentations, and annual reports stand out from your competition and impress.
1. Canva
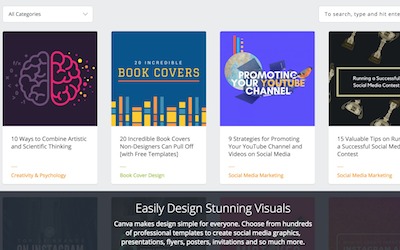
Canva allows you to design professional visuals for free. You post pictures to a virtual canvas with any text you want added in. You can use it for invitations, posters, presentations, social media posts, or any number of good uses. It is simple to use and you can pick from a good amount of free photos and cheap to purchase photos from searchable stock.
2. Bing Open Source Image Search
If you need pictures, photos, clip art or other graphics for your design that are free to use commercially, possibly the easiest resource to use is Bing’s search engine. Go to Bing and type in what you are looking for. Click on images, and select only “free to modify, share, and use commercially.” You will instantaneously get a page of images you can use for free for your work.
3. Google Slides
PowerPoint has been ubiquitous for now decades. Its increasingly steep purchase price, especially for professional office use, makes it difficult for small nonprofits to use. Competing presentation software companies have crept in as a result to take a market share. Google Slides is free and compatible with PowerPoint, allowing you to make comparable presentations online, with a team of other professionals, and for free.

4. Google Sheets
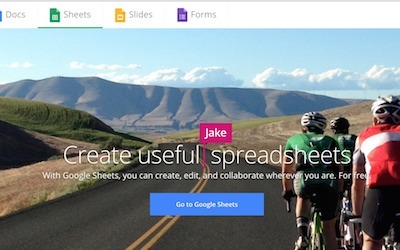
Similarly, if you can’t afford Microsoft Excel but need tables and charts from data in your presentations and proposals, you can use Google Sheets. It does not come close to Excel’s capacity, but it does allow you to make very professional tables, calendars, budgets, and charts from your data. Like Slides, it is compatible with Microsoft and you can upload and download your data with Excel.
5. Timelines in PowerPoint
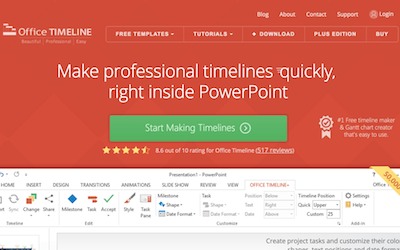
If you do have PowerPoint, a good resource for grant proposals especially is Office Timeline. The software downloads into your Microsoft program. Then you can convert your data to a timeline graphic for your project or proposal. The timelines are free. For a charge you can create a Gantt chart and other graphics as well. Even if the grant proposal does not require one, a Gantt chart of interesting timeline graphic can set you apart and add clarity to your narrative.
6. Piktochart
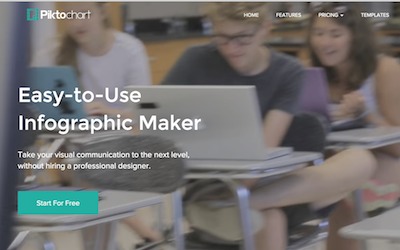
For annual reports, proposal graphics, presentations, or something interesting on your website, you can turn data quickly into a visual infographic with Piktochart. Infographics have become popular because including pictures and representing data in certain spatial relationships is proving to increase cognition for the viewer. They get your point across quicker and more effectively. For a small monthly fee Piktochart gives you access to hundreds of templates, or you can use a handful (that are generally sufficient if you are on a tight budget) for free.
7. Powtoon
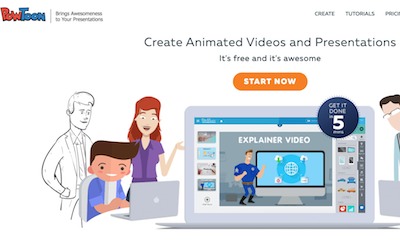
Videos now rule marketing. Statistics show that 80% of consumers want product videos. Sixty percent of site visitors to web pages look at videos before reading any text. And Youtube is the second largest search engine in the world. If you don’t have time and resources to film and produce videos, or if your program ideas are abstract, one phenomenal way to make videos for your products and services is Powtoon. In just a few minutes you can animate an entire video for your website or your next board presentation. Companies use it to engage staff as well in new work initiatives and ideas. Their free version will let you complete videos to post online.
8. Vimeo
If you do have time to film real videos, you might consider Vimeo to host your end products online. Unlike Youtube, you can share HD presentations and unlimited file sizes and there are no ads. It’s a perfect resource for nonprofits looking to share their work with specific donor prospects, board members, or other less public entities.
9. Logomakr
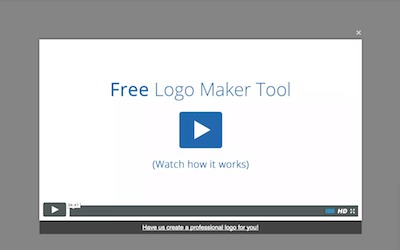
You can make professional logos for your programs, products, or just about anything with Logomakr‘s software. The graphics are free to use as long as you credit the software.
10. Survey Monkey
If you are itching to make an infographic, the first step is to actually have data to share. Survey Monkey is a survey collection software service on the web. For free, you can send an email based 10 question survey to anyone to rate your programs, your services, your website design, your customer service, etc.

11. Google Data Studio
Another good data producing source for your infographics and charts is Google’s free analytics service. It will measure your web site traffic and other useful information about your marketing efforts to help you design better strategies and graphics going forward.
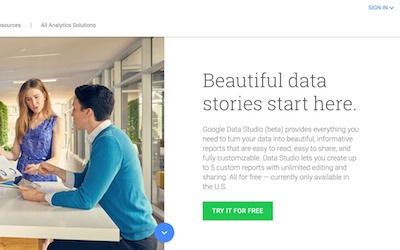
Google’s now coming out with a free service within analytics, Data Studio, to create graphics-based reports from the data for you nearly automatically!
Graphics have the potential to boost your marketing, fundraising, and communications to a whole other level. With both trusted and new web-based free resources, you can now generate nearly any of them for free.
